


Posted on April 06, 2020
A team from the University of Pretoria’s (UP) Department of Statistics in collaboration with other international universities has developed what is believed to be the first interactive app in the country that provides real-time data on COVID-19 using R-Shiny (a statistical software package).
As at Monday 6 April 2020, Global COVID-19 infections had exceeded 1.2 million, while the number of deaths was approaching 70 000. In South Africa, there were more than 1 600 infections and 11 confirmed deaths.
The data for the dashboard is collated from the World Health Organization and the Centers for Disease Control and Prevention in the United States, via GitHub (an online repository on which worldometer.com also bases its information).

The data for the dashboard is collated from the World Health Organization and the Centers for Disease Control and Prevention in the United States.
Professor Andriëtte Bekker, Head of the Department of Statistics, says the power of this app is two-fold. “It produces downloadable plots of COVID-19 counts, which includes the number of people infected, recovered or those who have passed away. The user can sort this by country or continent.” There is also an interactive setting whereby users can shift days since the first infection on a scale and see how the data has changed over time. In other words, the dashboard shifts power and autonomy to the user.
The team that worked on the dashboard includes Prof Bekker, senior UP lecturer Dr Johan Ferreira, and Professor Mohammad Arashi and Dr Mahdi Salehi, who are from Iranian institutions Shahrood University of Technology and the University of Neyshabur respectively. Prof Arashi is also an Extraordinary Professor in UP’s Department of Statistics as well as the National Research Foundation Chairholder of the South African Research Chair’s Initiative’s Research Chair in Computational and Methodological Statistics. Dr Salehi is a postdoctoral fellow. Postgraduate students Foad Esmaeili from the University of Neyshabur and UP’s Motala Frances, who is completing his honours degree in Mathematical Statistics, are also valuable contributors.

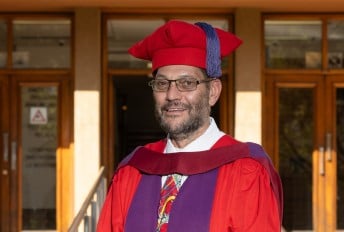
Professor Andriëtte Bekker, Head of UP's Department of Statistics.
“The investment of this app is human capital,” says Prof Bekker. “We are leveraging the joint intellectual capital of postgraduate students, postdoctoral fellows, and staff of UP, Shahrood University of Technology and the University of Neyshabur to develop and refine this dashboard. This also exemplifies what can be achieved with collaboration among universities.”
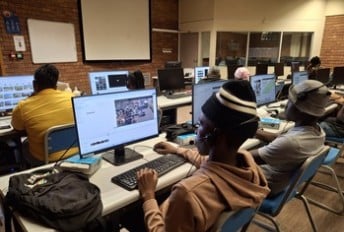
Dr Ferreira explains that the app was developed in statistical software R, which is free and open source and is based on the component (package) called “Shiny”, which creates real-time interactive web apps straight from R software. He says statistics has always been considered the premier discipline both in academic and daily life as it helps make sense of data.
“We have tapped into this historic legacy of statistics to be vital in understanding and exploring the cause and effects of, in this case, epidemiological modelling: for example, Florence Nightingale was not only the founder of modern nursing, but applied statistical techniques to understand disease modelling of British soldiers during the Crimean war in the 1850s.”

The app was developed in statistical software R, which is free and open source.
The idea for the app was based on Motala Frances’s honours research, which was under the guidance of Dr Salehi and initially aimed at producing an interactive web-based app in the education sector. But due to the rapidly changing global environment of the past few weeks, the project was realigned into an interactive web-based app for visualising and understanding data for any user based on COVID-19 data, says Prof Bekker. “This shows that necessity is the mother of invention, but in our case it was teamwork that realised this plan. However, Mr Motala and Dr Salehi worked tirelessly, and without them this would not have been possible.”
“Statistics has always had an indisputable legacy when it comes to data,” says Prof Bekker. “And in this data-driven era, we are bombarded with data from news outlets, social media and the like. Our department’s joint effort in this initiative aims to put the power of statistics at the users’ finger tips.”
UP’s Department of Statistics serves about 7 000 students in undergraduate programmes and more than 100 in postgraduate programmes annually. It is the biggest in the country. The department has wide-ranging research interests that include biostatistics, and computational and methodological statistics.
Please click on this link for the dashboard.

Copyright © University of Pretoria 2025. All rights reserved.

 Virtual Campus
Get Social With Us
Download the UP Mobile App