
Posted on January 01, 2018
LibQUAL+ is a tool that libraries can use to solicit, track, understand and act upon users’ opinions of service quality.
This quality survey is offered to the library community by the Association of Research Libraries (ARL). The protocol is a rigorously tested web-based survey that helps libraries assess and improve library services, change organizational culture, and market the library. The survey instrument measures library users’ minimum, perceived, and desired service levels of service quality across three dimensions: Affect of Service, Information Control, and Library as a Place.
In August 2017 the Department of Library Services invited all library users to rate the libraries’ service to gain a better understanding of their expectations, desires, and perceptions of library services. The Department of Library Services undertook this survey also in 2005, 2009 and 2013.
The online link was distributed through email signatures, the library web page, Facebook & Twitter, posters, ClickUP, the staff and student intranet, emails to postgraduate students, the Perdeby and on all library computers. An open-ended comments box at the end of the survey provided users an opportunity to comment on anything not covered in the survey. Users could also be entered into a lucky draw and incentives were offered after successful completion of the survey. Units and faculty libraries also competed for the Team spirit and Highest participation prizes.
The final report from the Association of Research Libraries was received early in September 2017 and the qualitative data (a total of 3404 comments) had to be analysed by the Quality Office using Atlas.ti. The prize-giving ceremony took place on 20 September and a total of 18 students walked away with the sponsored prizes. The highest percentage of client participation prize was won by the BMS Library. The Team spirit prizes were shared by the Merensky 2 Circulation team and the Engineering, Built Environment, Information Technology and Natural & Agricultural Sciences team (level 5).
A total of 5 766 users (10,81% of the total UP population – highest internationally) completed the survey: 4 380 undergraduates, 936 postgraduates, 306 academic staff and 141 support staff members. The overall results indicated that the minimum service quality that users are willing to accept is 6.82, the desired service quality is 7.96 and the overall perceived service quality is 7.28 – am improvement from 2013 when the overall score was 7.19.
Overall results:
|
Dimension |
Minimum mean |
Desired mean |
Perceived mean |
|
Affect of Service |
6.87 |
7.89 |
7.35 |
|
Information Control |
6.78 |
8.00 |
7.25 |
|
Library as Place |
6.80 |
8.00 |
7.21 |
|
Overall |
6.82 |
7.96 |
7.28 |
The highest score was achieved for library staff who have the knowledge to answer user questions (7.49) and Willingness to help users (7.49).
Of the 3 430 comments received 2 107 were positive, 1 210 negative and 174 ambivalent comments. The majority of the users made IT related complaints; this includes slow internet connections, high volume of computers that are not working, a shortage of computers and other students using computers for non-academic purposes. There were also complaints in terms of accessing electronic resources, limited study space and that some staff members were rude or unfriendly.
In summary the library service quality falls within the zone of tolerance and users are generally satisfied with the service quality with some grievances around information control for postgraduate students and academic staff.
The data will now be used to further identify our strengths, weaknesses and areas that require further improvement in order to align our library services with user expectations.
Lastly the Quality Office would like to express gratitude to our sponsors Sabinet, Bookmark and Wiley for the wonderful prizes that they offered as incentives as the Quality team believes they assist in achieving this high participation rate.

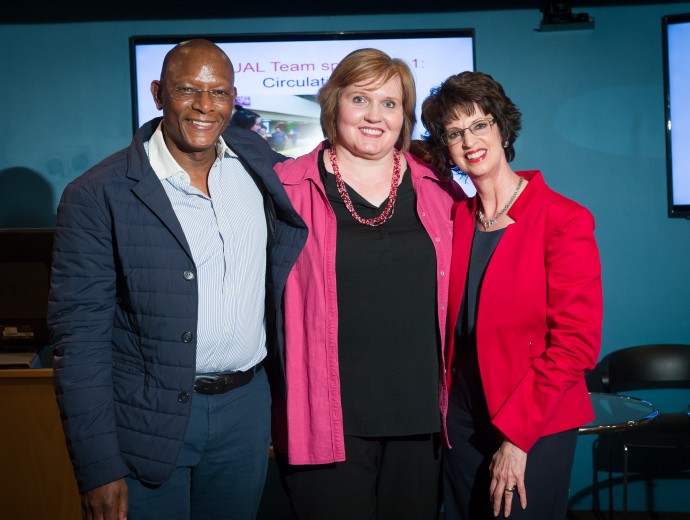
From left to right: Robert Moropa, Jean Nell (representing the sponsor Sabinet) and Elsabe Olivier
Copyright © University of Pretoria 2025. All rights reserved.
 Virtual Campus
Get Social With Us
Download the UP Mobile App